
Pedestrian safety remains a central issue in Los Angeles County, especially as current trends indicate that total vehicle crashes are decreasing, but injuries and fatalities to pedestrians are rising every year. In 2015, the Vision Zero initiative was started with the hopes of reducing traffic fatalities in the county, but since its inception, the number of pedestrian fatalities has actually increased by more than 70 percent.
We wanted to analyze if there were specific times of the day where serious pedestrian accidents were more likely to occur. So, we gathered pedestrian accident data from the California Statewide Integrated Traffic Records System for LA County in 2018. Then, we broke down this data into hour blocks to effectively determine what times had the highest incidence of pedestrian injuries and fatalities.
| TIME OF DAY | PEDESTRIANS KILLED | PEDESTRIANS INJURED |
|---|---|---|
| 12am-1am | 13 | 101 |
| 1am-2am | 11 | 78 |
| 2am-3am | 16 | 70 |
| 3am-4am | 5 | 39 |
| 4am-5am | 10 | 45 |
| 5am-6am | 12 | 83 |
| 6am-7am | 13 | 148 |
| 7am-8am | 7 | 317 |
| 8am-9am | 4 | 316 |
| 9am-10am | 3 | 245 |
| 10am-11am | 6 | 223 |
| 11am-12pm | 7 | 201 |
| 12pm-1pm | 5 | 250 |
| 1pm-2pm | 1 | 242 |
| 2pm-3pm | 0 | 297 |
| 3pm-4pm | 3 | 386 |
| 4pm-5pm | 6 | 344 |
| 5pm-6pm | 19 | 416 |
| 6pm-7pm | 15 | 450 |
| 7pm-8pm | 18 | 425 |
| 8pm-9pm | 24 | 362 |
| 9pm-10pm | 29 | 297 |
| 10pm-11pm | 17 | 237 |
| 11pm-12am | 10 | 144 |
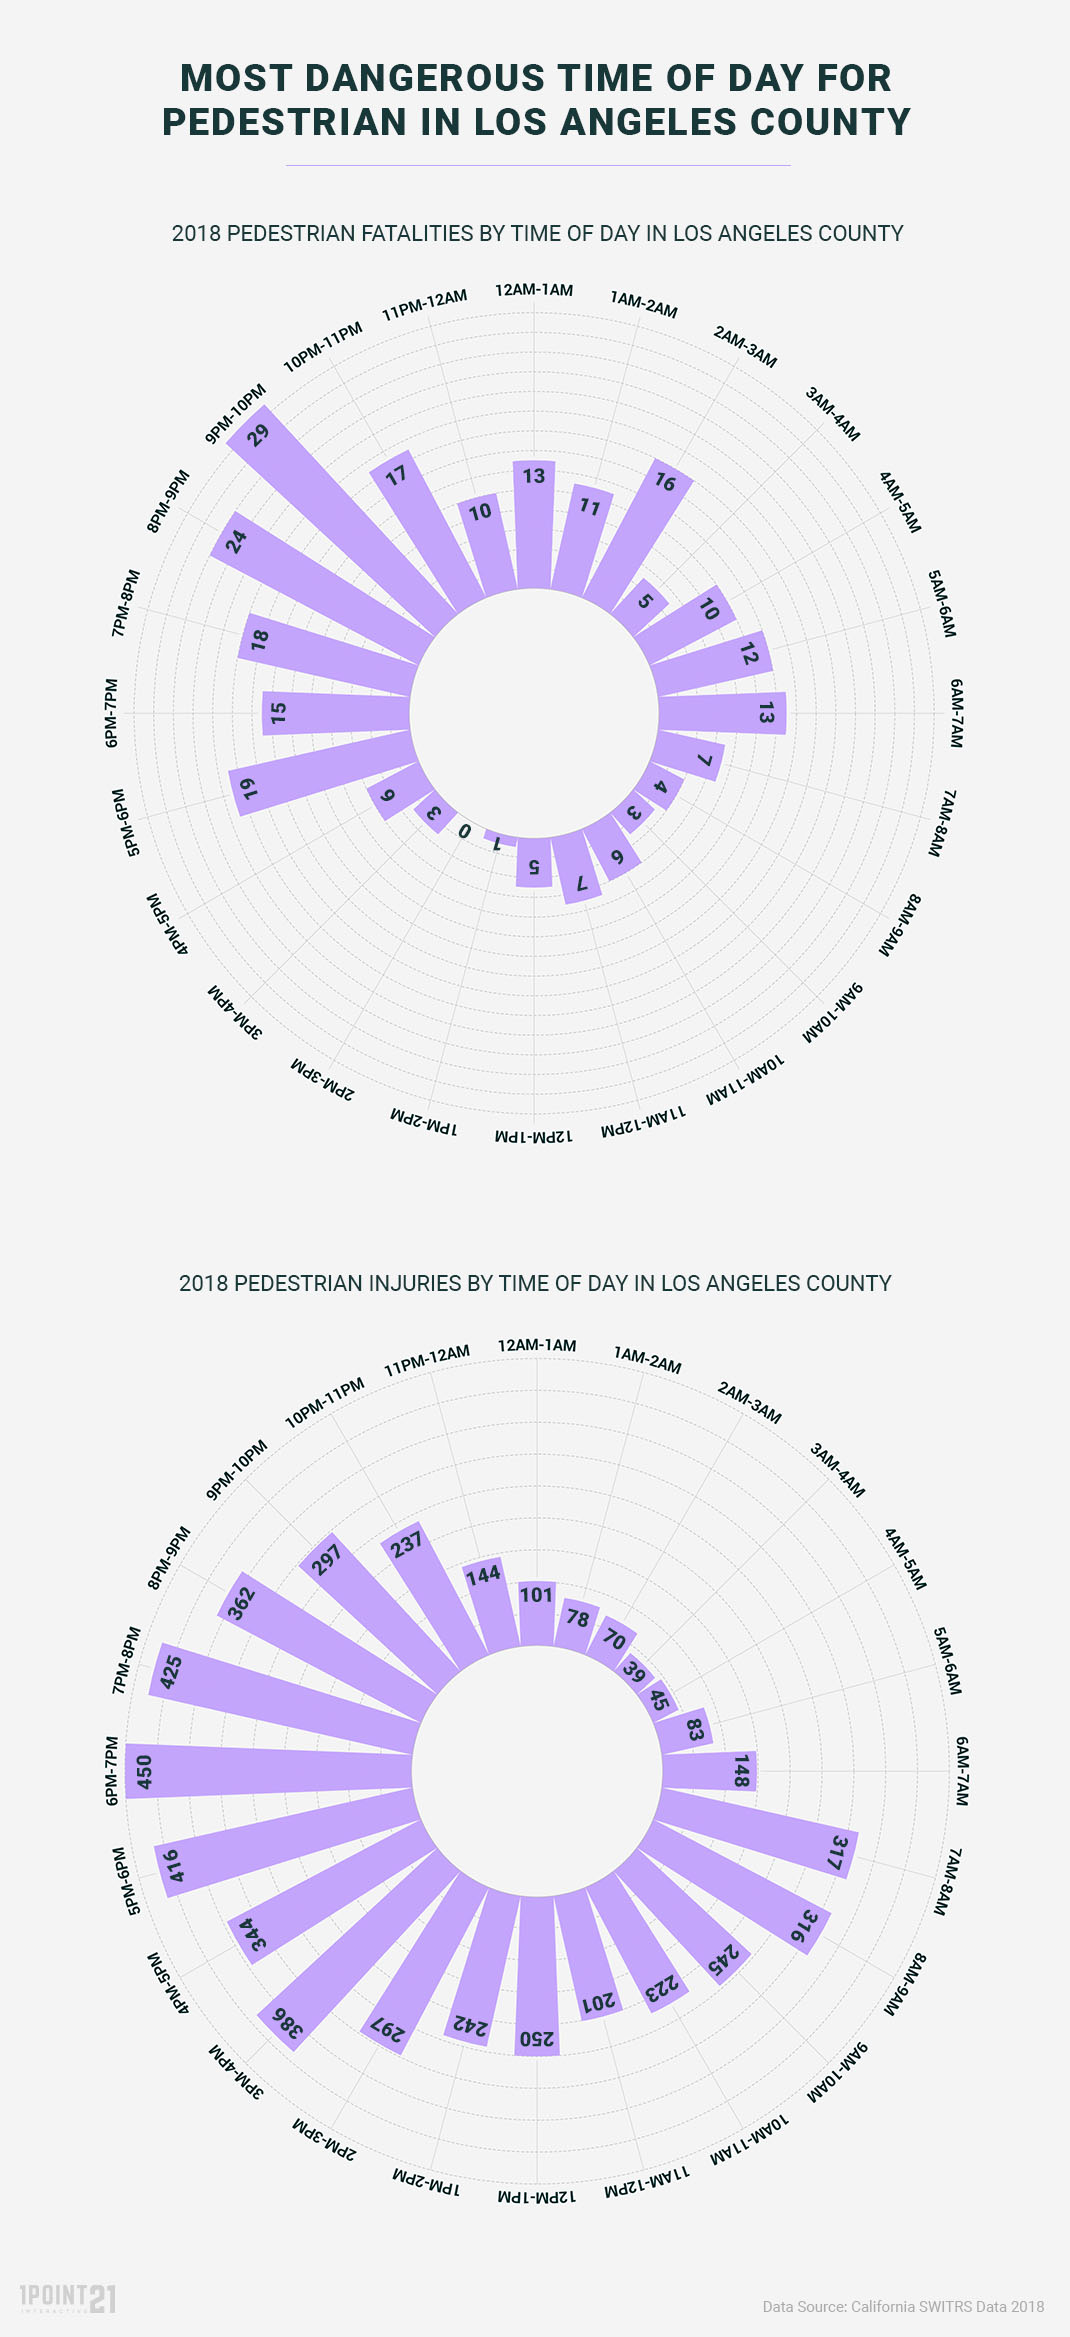
Pedestrian Injuries by Time of Day
When the total pedestrian injuries caused by a crash are categorized by time of day, a clear pattern emerges which seems to be consistent with typical rush hour traffic patterns, with two spikes occurring early in the day and later in the afternoon.
From 7AM-9AM is the first spike in pedestrian injuries, where everyone is presumably heading to work, dropping off their children to school, and starting their day. The sudden spike in pedestrian activity (and therefore injuries) is dramatic: the time block from 7AM-8AM shows a significant 114% increase in pedestrian injuries from the previous hour.
The second spike occurs during the later rush hour period. Occurring from 5PM to 8PM, this is the period with the highest number of crashes resulting in pedestrian injuries – the only hour periods where pedestrian injuries exceed 400 each hour. 6PM-7PM is where pedestrian injuries were highest in 2018, with 450 pedestrian injuries.
From 9PM on, the number of pedestrian injuries follows a downward trend, until it hits the lowest point from 3-4AM.
One other interesting spike occurs at 3PM-4PM, where there were 386 pedestrian injuries caused by an accident. This is likely explained by school scheduling – generally, most schools get out in LA County from 2PM-4PM. This leads to more foot traffic near school zones, greater congestion from parents picking up their children, and added potential for distracted driving.
It would be interesting to see how if this trend persists on weekends, where the ebbs and flows of traffic don’t follow the same rush hour patterns.
Pedestrian Fatalities by Time of Day
When comparing the total number of pedestrian fatalities caused by accidents, they generally seem to follow the same trends as the pedestrian injuries above – albeit with a couple key differences.
Much like the timetable of pedestrian injuries above, the number of fatalities generally seem to be highest in the late afternoon through the evening, 5PM-11PM – with a spike occurring from 8-10PM. Likewise, there’s also a smaller spike that occurs in the early morning, from 4AM-7AM.
However, unlike the pedestrian injuries, there is no additional spike that occurs in the mid-afternoon. Instead, there is a consistent amount of pedestrian fatalities occurring in the late evenings/early mornings, from midnight-3AM.
Possible Causes for These Differences
The discrepancies between the data for pedestrian injuries and pedestrian fatalities could be due to a couple of reasons.
- Driving during the night is significantly more dangerous than driving during the day – according to the National Safety Council, 50 percent of all traffic fatalities happen at night. This is primarily due to reduced visibility of your surroundings. Even with high-beam headlights on, nighttime visibility has a range of 500 feet at most, which can hamper your ability to react to things that suddenly pop up on the road.
- There is a greater chance of encountering drunk drivers during the nighttime. In fact, according to the Automobile Association of America (AAA), the highest number of drunk drivers are on the road from midnight-3AM – coincidentally right where we see a spike in pedestrian fatalities.
- LA County has fairly unique traffic patterns – especially during the evenings. The spike in pedestrian fatalities from 8-10PM could be attributed to additional foot and vehicle traffic as people go out and enjoy the nightlife.
- There may be a higher occurrence of fatalities during the weekends than the weekdays. This may be why the pedestrian fatalities do not follow the same trend as pedestrian injuries.
Top 25 Cities in LA County with Pedestrian Crashes
When total pedestrian crashes in LA County are categorized by city, the city of Los Angeles tops the rankings in all categories. 57% of all total crashes occur in LA, leading to 131 fatal crashes – more than half of all pedestrian fatalities in the county. A wide, sprawling city that houses over 3.7 million residents, it’s not surprising that LA would also have the highest number of total pedestrian crashes.
| 1 | Los Angeles | 3340 | 3301 | 131 |
| 2 | Unincorporated | 413 | 392 | 23 |
| 3 | Long Beach | 360 | 339 | 7 |
| 4 | Santa Monica | 90 | 91 | 0 |
| 5 | Pomona | 89 | 77 | 10 |
| 6 | Glendale | 84 | 87 | 2 |
| 7 | Pasadena | 77 | 77 | 3 |
| 8 | Inglewood | 60 | 60 | 1 |
| 9 | West Hollywood | 60 | 57 | 1 |
| 10 | Alhambra | 58 | 58 | 1 |
| 11 | Lancaster | 56 | 47 | 6 |
| 12 | Torrance | 48 | 48 | 2 |
| 13 | Compton | 44 | 39 | 6 |
| 14 | Downey | 44 | 41 | 4 |
| 15 | El Monte | 44 | 44 | 0 |
| 16 | Palmdale | 37 | 32 | 3 |
| 17 | Monterey Park | 37 | 34 | 2 |
| 18 | Bellflower | 35 | 31 | 5 |
| 19 | South Gate | 35 | 38 | 1 |
| 20 | Norwalk | 33 | 28 | 4 |
| 21 | West Covina | 32 | 29 | 4 |
| 22 | Huntington Park | 32 | 31 | 1 |
| 23 | Gardena | 31 | 32 | 1 |
| 24 | Lakewood | 31 | 30 | 1 |
| 25 | Hawthorne | 30 | 26 | 2 |
Unincorporated parts of the county ranked second, and Long Beach (2nd in population in the county) ranked third.
Interestingly, Santa Monica had the fourth-highest number of pedestrian accidents, despite having roughly a fifth of the population of Long Beach. This could be due to the generally pedestrian-friendly nature of the city, combined with a large amount of traffic from tourists and other sightseers.
The city of Pomona ranked fifth with just 89 total crashes – but those led to 10 fatalities, the third most in the list. There doesn’t seem to be any apparent reason as to the high rate of pedestrian fatalities in this city, but it definitely merits further investigation.
Other Notable Findings
Interestingly, a majority of pedestrian accidents in LA County didn’t occur at intersections: only 2267 crashes occurred at or in the proximity of an intersection, such as a crosswalk – roughly 39% of all pedestrian crashes in the county for 2018. While this percentage remained roughly the same in pedestrian injuries, the difference in pedestrian fatalities between intersection and non-intersection collisions was significant: 52 fatalities vs 201 fatalities, respectively. This is likely due to general safety precautions at intersections to prevent such serious accidents. At non-intersections, there is a greater likelihood of unexpected things happening, such as pedestrians darting out into the sidewalk – which can lead to serious fatal consequences.
Additionally, a concerning amount of drivers did not stay at the scene to ensure the pedestrians’ safety. 32% of total pedestrian crashes were hit-and-run incidents, with 88% of those being felony violations. In hit-and-run cases, misdemeanor charges typically mean that there is only property damage and no injuries – while felony charges equate to serious injuries and fatalities.
Closing Thoughts
Although many proponents believe that the Vision Zero initiative set forth in 2015 has largely been ineffective thus far, there may be a large number of circumstances and reasons beyond the initiative that may not have worked in its favor. And while studies like this one may paint a grave picture for the safety of pedestrians in LA County, our Los Angeles personal injury lawyers hope that they can serve to inform those who can institute change to improve the safety of the streets for motorists, cyclists, and pedestrians alike.